Determine if a relation, equation, or graph defines a function using the definition as well as the vertical line test.
Subsection2.1.1Activities
Definition2.1.1.
A relation is a relationship between sets of values. Relations in mathematics are usually represented as ordered pairs: (input, output) or \((x, y)\text{.}\) When observing relations, we often refer to the \(x\)-values as the domain and the \(y\)-values as the range.
Definition2.1.2.
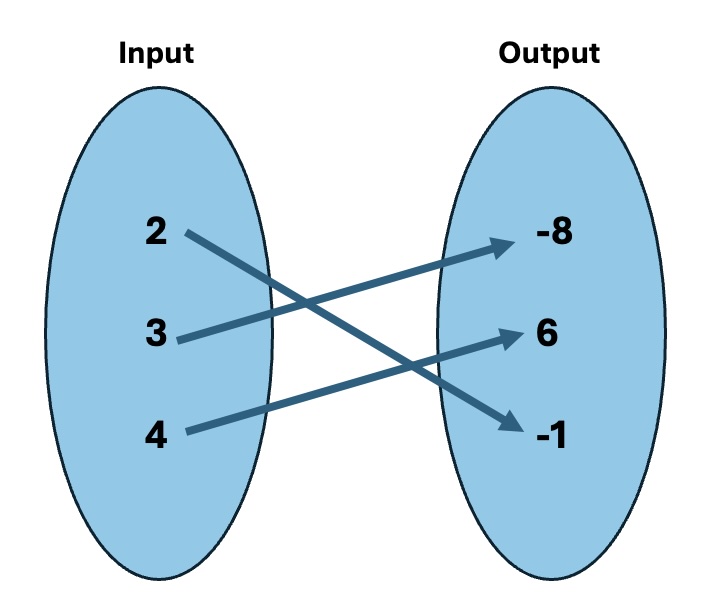
Mapping Notation (also known as an arrow diagram) is a way to show relationships visually between sets. For example, suppose you are given the following ordered pairs: \((3, -8), (4,6)\text{,}\) and \((2,-1)\text{.}\) Each of the \(x\)-values "map onto" a \(y\)-value and can be visualized in the following way:
Figure2.1.3.Every \(x\)-value from the ordered pair list is listed in the input set and every \(y\)-value is listed in the output set. An arrow is drawn from every \(x\)-value to its corresponding \(y\)-value.
Notice that an arrow is used to indicate which \(x\)-value is mapped onto its corresponding \(y\)-value.
Activity2.1.4.
Use mapping notation to create a visual representation of the following relation.
Notice that in Activity 2.1.4, Activity 2.1.5, and Activity 2.1.6, each set represents a very different relationship. Many concepts in mathematics will depend on particular relationships, so it is important to be able to visualize relationships and compare them.
Definition2.1.8.
A function is a relation where every input (or \(x\)-value) is mapped onto exactly one output (or \(y\)-value).
Note that all functions are relations but not all relations are functions!
Activity2.1.9.
Relations can be expressed in multiple ways (ordered pairs, tables, and verbal descriptions).
(a)
Let’s revisit some of the sets of ordered pairs we’ve previously explored in Activity 2.1.4, Activity 2.1.5, and Activity 2.1.6. Which of the following sets of ordered pairs represent a function?
\(\displaystyle (-1,5), (2,6), (4,-2)\)
\(\displaystyle (6,4), (3,4), (6,5)\)
\(\displaystyle (1,2), (-5,2), (-7,2)\)
\(\displaystyle (-1,2), (-1,9), (1,9)\)
Answer.
A and C
(b)
Note that relations can be expressed in a table. A table of values is shown below. Is this an example of a function? Why or why not?
\(x\)
\(y\)
\(-5\)
\(-2\)
\(-4\)
\(-5\)
\(-2\)
\(8\)
\(8\)
\(-4\)
\(8\)
\(1\)
Answer.
This relation is not a function. The \(x\)-value, \(8\text{,}\) has two outputs.
(c)
Relations can also be expressed in words. Suppose you are looking at the amount of time you spend studying versus the grade you earn in your Algebra class. Is this an example of a function? Why or why not?
Answer.
Yes, this is an example of a function.
Remark2.1.10.
Notice that when trying to determine if a relation is a function, we often have to rely on looking at the domain and range values. Thus, it is important to be able to idenfity the domain and range of any relation!
Activity2.1.11.
For each of the given functions, determine the domain and range.
The amount of time you spend studying versus the grade you earn in your Algebra class.
Answer.
Domain: {time studying}; Range: {grade in Algebra class}
Activity2.1.12.
Determine whether each of the following relations is a function.
(a)
Answer.
This relation is a function.
(b)
Answer.
This relation IS NOT a function.
(c)
Answer.
This relation is a function.
Remark2.1.13.
You probably noticed (in Activity 2.1.12) that when the graph has points that "line up" or are on top of each other, they have the same \(x\)-values. When this occurs, this shows that the same \(x\)-value has two different outputs (\(y\)-values) and that the relation is not a function.
Definition2.1.14.
The vertical line test is a method used to determine whether a relation on a graph is a function.
Start by drawing a vertical line anywhere on the graph and observe the number of times the relation on the graph intersects with the vertical line. If every possible vertical line intersects the graph at only one point, then the relation is a function. If, however, the graph of the relation intersects a vertical line more than once (anywhere on the graph), then the relation is not a function.
Activity2.1.15.
Use the vertical line test (Definition 2.1.14) to determine whether each graph of a relation represents a function.
(a)
Answer.
This graph does not pass the vertical line test and is therefore NOT a function.
(b)
Answer.
This graph passes the vertical line test and is therefore a function.
(c)
Answer.
This graph passes the vertical line test and is therefore a function.
(d)
Answer.
This graph does not pass the vertical line test and is therefore NOT a function.
Activity2.1.16.
Let’s explore how to determine whether an equation represents a function.
(a)
Suppose you are given the equation \(x=y^2\text{.}\)
If \(x=4\text{,}\) what kind of \(y\)-values would you get for \(x=y^2\text{?}\)
Based on this information, do you think \(x=y^2\) is a function?
Answer.
If \(x=4\text{,}\)\(y\) could be \(-2\) or \(2\text{.}\) Given that there are two outputs for a given \(x\text{,}\) then \(x=y^2\) is not a function.
(b)
Suppose you are given the equation \(y=3x^2+2\text{.}\)
If \(x=4\text{,}\) what kind of \(y\)-values would you get for \(y=3x^2+2\text{?}\)
Based on this information, do you think \(y=3x^2+2\) is a function?
Answer.
If \(x=4\text{,}\)\(y=50\text{.}\) For every input (\(x\)-value), there is exactly one output (\(y\)-value) so \(y=3x^2+2\) is a function.
(c)
Suppose you are given the equation \(x^2+y^2=25\text{.}\)
If \(x=4\text{,}\) what kind of \(y\)-values would you get for \(x^2+y^2=25\text{?}\)
Based on this information, do you think \(x^2+y^2=25\) is a function?
Answer.
If \(x=4\text{,}\)\(y\) could be \(-3\) or \(3\text{.}\) Given that there are two outputs for a given \(x\text{,}\) then \(x^2+y^2=25\) is not a function.
(d)
Suppose you are given the equation \(y=-4x-3\text{.}\)
If \(x=4\text{,}\) what kind of \(y\)-values would you get for \(y=-4x-3\text{?}\)
Based on this information, do you think \(y=-4x-3\) is a function?
Answer.
If \(x=4\text{,}\)\(y=-19\text{.}\) For every input (\(x\)-value), there is exactly one output (\(y\)-value) so \(y=-4x-3\) is a function.
(e)
How can you look at an equation to determine whether or not it is a function?
Answer.
Students may have different answers. Ideally, you want students to see that they can check whether a given relation is a function in more than one way. They can test values (as this activity did by leading them to plug in values) or by using the vertical line test on a graph.
Remark2.1.17.
Notice that Activity 2.1.16 shows that equations with a \(y^2\) term generally do not define functions. This is because to solve for a squared variable, you must consider both positive and negative inputs. For example, both \(2^2=4\) and \((-2)^2=4\text{.}\)
Activity2.1.18.
It’s important to be able to determine the domain of any equation, especially when thinking about functions. Answer the following questions given the equation \(y=\sqrt{x}\text{.}\)
(a)
What values of \(x\) would give an error (if any)?
\(\displaystyle -2\)
\(\displaystyle 0\)
\(\displaystyle 4\)
\(\displaystyle -5\)
Answer.
A and D
(b)
Based on this information, for what values of \(x\) would the equation exist?
\(\displaystyle -2\)
\(\displaystyle 0\)
\(\displaystyle 4\)
\(\displaystyle -5\)
Answer.
B and C
(c)
How can we represent the domain of this equation in interval notation?
\(\displaystyle (-\infty,0)\)
\(\displaystyle [0,\infty)\)
\(\displaystyle (0, 0)\)
\(\displaystyle (-\infty,\infty)\)
Answer.
B
Activity2.1.19.
Answer the following questions given the equation \(y=-5x+1\text{.}\)
(a)
What values of \(x\) would give an error (if any)?
\(\displaystyle -2\)
\(\displaystyle 0\)
\(\displaystyle 4\)
\(\displaystyle -5\)
Answer.
None of the values will give an error.
(b)
Based on this information, for what values of \(x\) would the equation exist?
\(\displaystyle -2\)
\(\displaystyle 0\)
\(\displaystyle 4\)
\(\displaystyle -5\)
Answer.
A, B, C, and D
(c)
How can we represent the domain of this equation in interval notation?
\(\displaystyle (-\infty,0)\)
\(\displaystyle (0,\infty)\)
\(\displaystyle (-5, 1)\)
\(\displaystyle (-\infty,\infty)\)
Answer.
D
Activity2.1.20.
Answer the following questions given the equation \(y=\dfrac{3}{x-5}\text{.}\)
(a)
What values of \(x\) would give an error (if any)?
\(\displaystyle -3\)
\(\displaystyle 0\)
\(\displaystyle -4\)
\(\displaystyle 5\)
Answer.
D
(b)
Based on this information, for what values of \(x\) would the equation exist?
\(\displaystyle -3\)
\(\displaystyle 0\)
\(\displaystyle -4\)
\(\displaystyle 5\)
Answer.
A, B, and C
(c)
How can we represent the domain of this equation in interval notation?
\(\displaystyle (-\infty,5)\)
\(\displaystyle (5,\infty)\)
\(\displaystyle (-5, 5)\)
\((-\infty,5)\)U\((5,\infty)\)
Answer.
D
Remark2.1.21.
When determining the domain of an equation, it is often easier to first find values of \(x\) that make the function undefined. Once you have those values, then you know that \(x\) can be any value but those.